By Andrew Wang, FMCG Insight Analyst
Bananas are still Australia’s go-to fruit for a natural, healthy and quick way to ‘make your body sing’, according to latest Nielsen data.
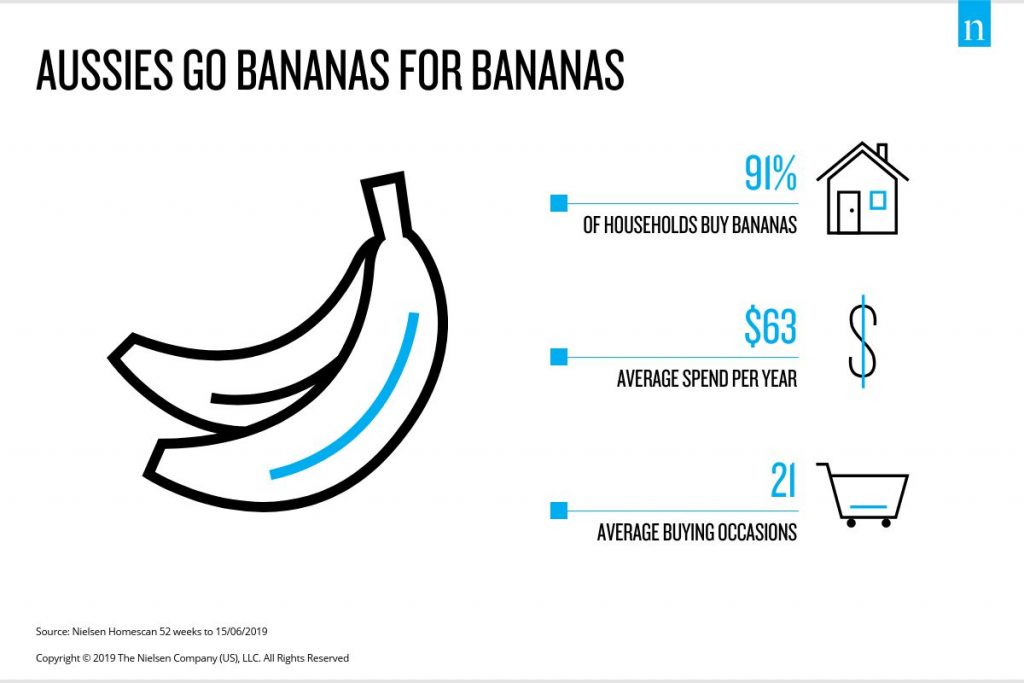
On average, Australian households continue to ‘Peel good. Feel good’, spending an average of $63 a year on bananas. Dollar sales for bananas increased by 9.7% over the past year driven by a 13.8% price rise.
Higher prices led to bananas taking out first place as the highest selling produce item in the current Nielsen-Produce Plus top 20 Fruit and Vegetable Report.
MAJOR RETAILERS CONTINUE TO DRIVE SALES
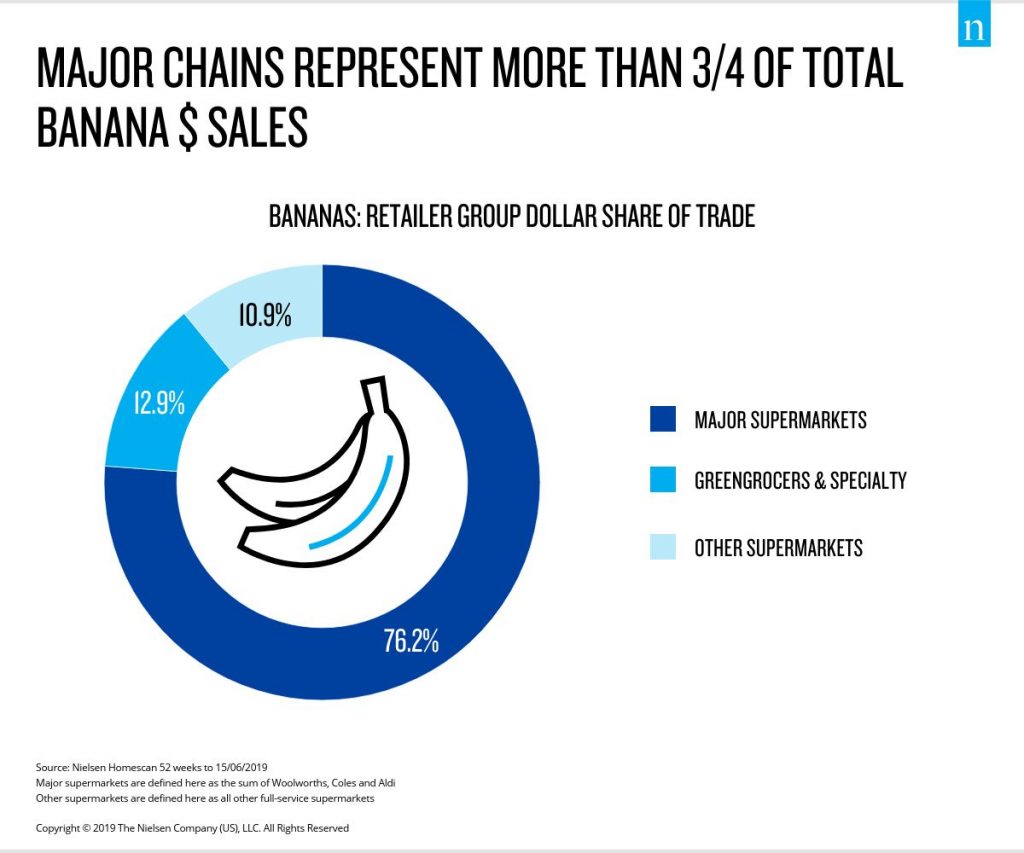
Major supermarkets continue to be an important channel for bananas. These retailers accounted for 76.2% dollar share of trade of total bananas and 73.2% volume share of trade. All retailer groups saw an increase in dollar sales, with major supermarkets growing the fastest at 10.8%, followed closely by other supermarkets with a 9.2% increase in the past year.
Purchasing loose bananas continue to be the most popular format, contributing to over 90% of dollar sales across all retailers and the key driver of dollar growth. Pre-packed bananas, although relatively small, continue to grow: kids bananas leads the way in this segment growing in both volume and dollar sales.
SENIOR AND ESTABLISHED COUPLES DRIVING BANANA SALES
Over the past year, senior couples accounted for a quarter of the bananas sold in Australia, followed by established couples who accounted for one-fifth of banana dollar sales. Bustling families are also an important consumer group for bananas making up 15% of the dollar sales. Kids bananas, while only contributing 2.3% of banana dollar sales, had the highest rate of growth in both dollar and volume terms. These trends suggest that along with senior and established couples, bustling families are also enjoying the taste of bananas and increasingly reaching for them as their snack of choice.
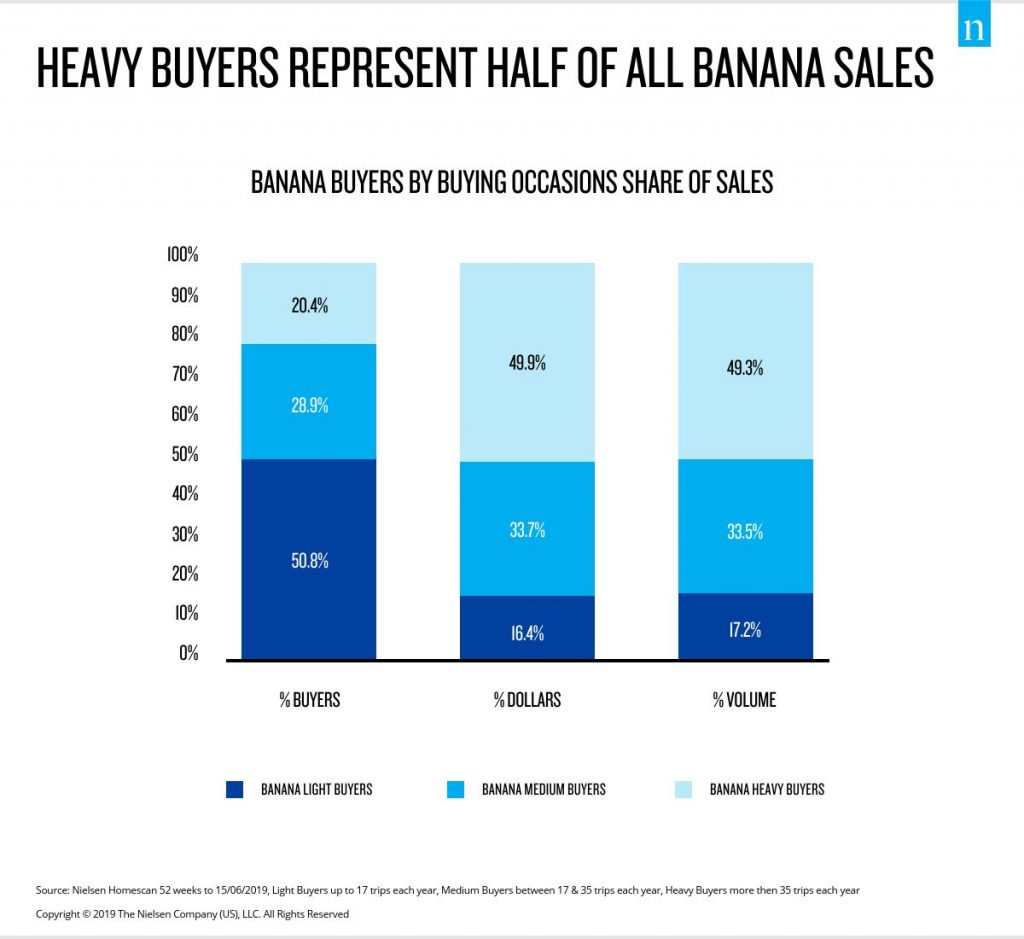
Banana buyers can be broken into three categories based on the number of buying occasions each year. Light buyers; buyers with up to 17 trips per year, accounted for half the total banana buyers in the past year, but this group contributed the least to total banana dollar and volume sales. Heavy buyers on the other hand, buyers with more than 35 trips per year, accounted for only one-fifth of the banana buyers but contributed to almost half of total banana dollar and volume sales.
One of the biggest opportunities for bananas would be to convert light buyers to medium buyers; if light buyers purchased bananas just one more time a year it would equate to $30.2 million in dollar sales and 6,450 tonnes in volume sales.
ETHNIC HOUSEHOLDS ENJOYING BANANAS
The banana category has seen an increase in dollar and volume growth from ethnic households. Ethnic households have continued to grow their average spend per household (+13.4%) and average volume per household (+0.4%) in the past year. Among these households, Cavendish bananas have been the most favoured however, the increase in ethnic households across Australia opens the door of opportunity to introduce new banana varieties.
OPPORTUNITY FOR GROWTH
Despite a decline in volume sales, bananas were the highest selling produce category with the past year’s performance propelled by a rise in average prices. Keeping bananas top-of-mind as a healthy energy snack, particularly for families and senior couples, is important to maintain and increase sales. Encouraging an increase in buying occasions of light buyers offers a significant opportunity, while expanding the varieties of bananas available in Australia may also broaden the current consumer base.
Notes:
• Major supermarkets are defined here as the sum of Woolworths, Coles and Aldi
• Other supermarkets are defined here as all other full-service supermarkets
• Senior Couples are 2 or more adults (no children <=17 years), Head of HH 60+ years
• Established Couples are 2 or more adults (no children <=17 years), Head of HH 35-39 years
• Bustling Families are households with youngest child 12-17 years
• Ethnic households defined by non-English speaking households
• Non-ethnic households defined by English speaking households
Sources: Nielson Homescan 52 weeks to 15/06/2019


